


Regulation Bowling Ball: C.A.T.S data available from the first World Challenge
05/17/06
 Bowlingdigital has received some of the C.A.T.S. data from the first World Tenpin Bowling Association World Challenge at the Kegel Training Center in Lake Wales, April 22, 2006.
The invitational tournament was the very first event in the history of the WTBA, in which players could only use the "WTBA Test Ball", an early version of the WTBA Technical Committees vision of a new "Regulation Bowling Ball".
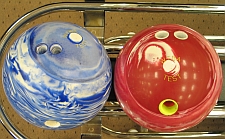 All players used only this supplied bowling ball for all deliveries, which was available in two weights - 15 lbs. (red) and 16 lbs. (blue).
All test balls were given to the players prior to the competition and had between 2.5 and 3.5 ounces of top weight prior to drilling.
To get maximum information from the event, the WTBA Technical Committee allowed the players to place the center of gravity (CG) at any position.
 Ted Thompson, Kegel's representative in Europe, was responsible for the lane maintenance and used only a fraction of the normal amount of oil by today’s standards for the 34-feet pattern: Total volume per lane was 7.21 ml with a 4:1 ratio from least to the most amount of conditioner. The lane pattern graphs showed 3.1 units of oil outside two feet before the end of the pattern, which is just above the legal limit according to USBC specifications.
Players were allowed 30 minutes of practice across the center prior to the start of competition. To maximize the number of games per lane, the WTBA Technical Committee placed three players on each lane and the event consisted of eight straight games.
Players used the international style of crossing pairs, players on the left lane moved left and players on the right lanes moved right.
Including practice and competition, there were over 28 games played per lane on one conditioning. This equates to almost two full shifts of five person team league play.
We have posted the C.A.T.S data of all eight games of the following six top ten finishers:
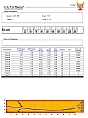
 Bob Learn Jr. - The five-time PBA champion won the inaugural event with games of 256, 227, 236, 217, 278, 205, 238 and 223 and an 1880 eight-game total which is an average of 235.00.
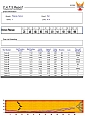
 Vernon Petersen - The 1996 U.S. National Amateur Champion finished with 1770 including high games of 258 and 247 and an average of 221.25 to grab the second place.
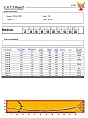
 Matt Gilman - The former Junior Team USA member who dominated the 2002 Tournament of America’s event by winning gold medals in all six events, had a low game of 199 and a high game of 237 to end up in third place with 1715 and a 214.38 average.
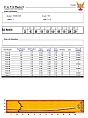
 Bob Handley - The PBA National and Senior champion, known as "Cranking Bob" during his PBA touring days, had high games of 227 and 229, but had to settle for fourth place (1675) due to back-to-back sub-200 scores in the sixth and seventh game.
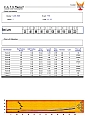
 Sami Luoto - The coach of the Finnish national team and member of the WTBA Technical Committee was the best European participant in 10th place with 1627. He was tied with
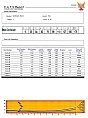
 Storm DeVincent - A Long time journey man in bowling, who has two 2nd place finishes on the PBA National Tour and multiple regional titles to his credit, started and finished with a sub-200 game. He tied Luoto thanks to a 184-183 in last game.
Click on the C.A.T.S. images to open the C.A.T.S data (pdf files, approx. 510Kb each).
Event Information
WTBA News
Bowlingdigital has received some of the C.A.T.S. data from the first World Tenpin Bowling Association World Challenge at the Kegel Training Center in Lake Wales, April 22, 2006. The invitational tournament was the very first event in the history of the WTBA, in which players could only use the "WTBA Test Ball", an early version of the WTBA Technical Committees vision of a new "Regulation Bowling Ball".
All players used only this supplied bowling ball for all deliveries, which was available in two weights - 15 lbs. (red) and 16 lbs. (blue). All test balls were given to the players prior to the competition and had between 2.5 and 3.5 ounces of top weight prior to drilling.
To get maximum information from the event, the WTBA Technical Committee allowed the players to place the center of gravity (CG) at any position.
Ted Thompson, Kegel's representative in Europe, was responsible for the lane maintenance and used only a fraction of the normal amount of oil by today’s standards for the 34-feet pattern: Total volume per lane was 7.21 ml with a 4:1 ratio from least to the most amount of conditioner. The lane pattern graphs showed 3.1 units of oil outside two feet before the end of the pattern, which is just above the legal limit according to USBC specifications. Players were allowed 30 minutes of practice across the center prior to the start of competition. To maximize the number of games per lane, the WTBA Technical Committee placed three players on each lane and the event consisted of eight straight games.
Players used the international style of crossing pairs, players on the left lane moved left and players on the right lanes moved right.
Including practice and competition, there were over 28 games played per lane on one conditioning. This equates to almost two full shifts of five person team league play.
We have posted the C.A.T.S data of all eight games of the following six top ten finishers:
Bob Learn Jr. - The five-time PBA champion won the inaugural event with games of 256, 227, 236, 217, 278, 205, 238 and 223 and an 1880 eight-game total which is an average of 235.00. Vernon Petersen - The 1996 U.S. National Amateur Champion finished with 1770 including high games of 258 and 247 and an average of 221.25 to grab the second place. Matt Gilman - The former Junior Team USA member who dominated the 2002 Tournament of America’s event by winning gold medals in all six events, had a low game of 199 and a high game of 237 to end up in third place with 1715 and a 214.38 average. Bob Handley - The PBA National and Senior champion, known as "Cranking Bob" during his PBA touring days, had high games of 227 and 229, but had to settle for fourth place (1675) due to back-to-back sub-200 scores in the sixth and seventh game. Sami Luoto - The coach of the Finnish national team and member of the WTBA Technical Committee was the best European participant in 10th place with 1627. He was tied with Storm DeVincent - A Long time journey man in bowling, who has two 2nd place finishes on the PBA National Tour and multiple regional titles to his credit, started and finished with a sub-200 game. He tied Luoto thanks to a 184-183 in last game. Click on the C.A.T.S. images to open the C.A.T.S data (pdf files, approx. 510Kb each).
C.A.T.S. Report Explanations
Event Information
This area of the report shows the name of the bowler, the game number, the event, and which lanes the game was bowled on.
Pins Left Standing
This are of the report shows how many times that each pin combination was left standing during the game. (This is not shown on the supplied reports.)
C.A.T.S. Data
The chart on the report shows several properties. These are explained here.
• Shot Number: This shows the result of only the first shot of each frame. Second shots (spare attempts) are not represented in the data or shown on the graph.
• Ball Position Arrows: This is the location of the ball as it crosses the arrows for each shot. It is reported in fractions of a board.
• Ball Position Pins: This is the location of the ball as it enters the pins for each shot. It is reported in fractions of a board.
• Initial Velocity: This is the velocity of the ball when first measured at 11 feet towards the pins from the foul line. It is considered the velocity of the ball near the release point. Common range – 16-22 mph.
• Launch Angle: This is the angle the ball is traveling immediately after release. The angle is relative to a straight line going down the lane. Balls traveling toward the channel have a negative angle, and toward the pins has a positive angle.Common range - 0-4 degrees
• Entry Angle: This is the angle the ball is traveling as it enters the pins. The angle is relative to a straight line going down the lane. Common range – 2-7 degrees
• Rotation: This is the measure of the revolutions put on the ball by the bowler. It is measured in Revolutions Per Minute (RPM). Common range – 200-500 rpm.
• Lane: The lane number the shot was thrown on.
• Pins Left Standing: These are the pins left standing after the first ball shot. 0 = 10 pin, 1 = 1 pin, 2 = 2 pin, 3 = 3 pin, 4 = 4 pin, and so on.
Graph
The graph shows all the first ball shots thrown during the game. This graph gives a good general indication of how consistent a player was when throwing the ball. Notice the area around 35-45 feet (break point) to see how well the player got the ball to that area.
Pins Left Standing
This are of the report shows how many times that each pin combination was left standing during the game. (This is not shown on the supplied reports.)
C.A.T.S. Data
The chart on the report shows several properties. These are explained here.
• Shot Number: This shows the result of only the first shot of each frame. Second shots (spare attempts) are not represented in the data or shown on the graph.
• Ball Position Arrows: This is the location of the ball as it crosses the arrows for each shot. It is reported in fractions of a board.
• Ball Position Pins: This is the location of the ball as it enters the pins for each shot. It is reported in fractions of a board.
• Initial Velocity: This is the velocity of the ball when first measured at 11 feet towards the pins from the foul line. It is considered the velocity of the ball near the release point. Common range – 16-22 mph.
• Launch Angle: This is the angle the ball is traveling immediately after release. The angle is relative to a straight line going down the lane. Balls traveling toward the channel have a negative angle, and toward the pins has a positive angle.Common range - 0-4 degrees
• Entry Angle: This is the angle the ball is traveling as it enters the pins. The angle is relative to a straight line going down the lane. Common range – 2-7 degrees
• Rotation: This is the measure of the revolutions put on the ball by the bowler. It is measured in Revolutions Per Minute (RPM). Common range – 200-500 rpm.
• Lane: The lane number the shot was thrown on.
• Pins Left Standing: These are the pins left standing after the first ball shot. 0 = 10 pin, 1 = 1 pin, 2 = 2 pin, 3 = 3 pin, 4 = 4 pin, and so on.
Graph
The graph shows all the first ball shots thrown during the game. This graph gives a good general indication of how consistent a player was when throwing the ball. Notice the area around 35-45 feet (break point) to see how well the player got the ball to that area.