


A statistical approach to lane center certification
08/30/07
 As earlier reported the United States Bowling Congress has changed its requirements for lane dressing inspections.
According to USBC Technical Director Neil Stremmel, the reduced number of required inspections will lessen the workload of local associations.
However, the current spec says that every lane in each center must pass specifications set forth by USBC for the center to become certified.
Bowlingdigital has asked the USBC Equipment Specifications Department, if with the recent adjustment in lane dressing inspection requirements, USBC has also considered looking at reducing the number of lanes that has to be inspected for a center to become certified for competition.
Here is the answer:
Where:
Otherwise you would call
• v1 = 2â–ªx
• v2 = 2â–ª(n-x+1)
• p = 0.99 i.e. (at least) 99% of the lanes will meet the criteria for certification
• n = 24 i.e. the number of lanes to be inspected
• x = 24 i.e. the number of lanes inspected that meet the criteria for certification
• α = 0.01 i.e. the USBC has a 1% tolerable risk for making an error in decision
USBC Equipment Specifications and Certification
As earlier reported the United States Bowling Congress has changed its requirements for lane dressing inspections. According to USBC Technical Director Neil Stremmel, the reduced number of required inspections will lessen the workload of local associations.
However, the current spec says that every lane in each center must pass specifications set forth by USBC for the center to become certified.
Bowlingdigital has asked the USBC Equipment Specifications Department, if with the recent adjustment in lane dressing inspection requirements, USBC has also considered looking at reducing the number of lanes that has to be inspected for a center to become certified for competition.
Here is the answer:
With the recent change in lane dressing inspection requirements, the USBC Equipment Specifications and Certification department along with and Equipment Specifications Committee technical advisor Scott Sterbenz have completed a statistical analysis to determine if a bowling center needs to inspect every lane to earn certification for competition.
Recent inquires from USBC local associations have brought this question to the forefront mainly as a means for another possible time saving effort. Used as a Six Sigma statistical principle for analysis, hypothesis testing has been able to further explore the validity of this concept.
Hypothesis tests are used to make inferences about a population based on the data collected from a sample of that population. In the case of USBC lane certification testing, the data used for the hypothesis test is considered attribute data (the lane meets certification requirements or the lane does not meet certification requirements).
Since the USBC has a threshold, or target, for the proportion of lanes meeting the certification requirement, the 1-proportion statistical test is the appropriate hypothesis test to answer the question of whether a sample of lanes in a bowling center can be used to assume the certification status of all the lanes in that center.
The 1-proportion hypothesis test compares a target proportion to the lower bound of the confidence interval, calculated from the sample data collected. If the target is greater than the lower bound of the confidence interval, then the hypothesis test fails and one cannot be certain that the population will meet or surpass the target. If the target is less than the lower bound of the confidence interval, then the hypothesis test passes—one can be certain that the population will meet or surpass the target.
Recent inquires from USBC local associations have brought this question to the forefront mainly as a means for another possible time saving effort. Used as a Six Sigma statistical principle for analysis, hypothesis testing has been able to further explore the validity of this concept.
Hypothesis tests are used to make inferences about a population based on the data collected from a sample of that population. In the case of USBC lane certification testing, the data used for the hypothesis test is considered attribute data (the lane meets certification requirements or the lane does not meet certification requirements).
Since the USBC has a threshold, or target, for the proportion of lanes meeting the certification requirement, the 1-proportion statistical test is the appropriate hypothesis test to answer the question of whether a sample of lanes in a bowling center can be used to assume the certification status of all the lanes in that center.
The 1-proportion hypothesis test compares a target proportion to the lower bound of the confidence interval, calculated from the sample data collected. If the target is greater than the lower bound of the confidence interval, then the hypothesis test fails and one cannot be certain that the population will meet or surpass the target. If the target is less than the lower bound of the confidence interval, then the hypothesis test passes—one can be certain that the population will meet or surpass the target.
The 1-proportion hypothesis test and confidence interval is calculated using the following data:
• Minimum accepted proportion of the population desired to meet certification requirements (p)
• Number of lanes proposed to be inspected from the population of lanes in the bowling center (n)
• Number of lanes from the sample of lanes inspected that meet the certification requirements (x)
• The amount of tolerable risk in making an incorrect decision (α)
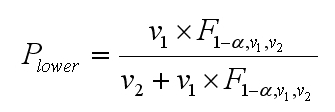
The exact calculation for the lower bound of the confidence interval for attribute data is:
• Minimum accepted proportion of the population desired to meet certification requirements (p)
• Number of lanes proposed to be inspected from the population of lanes in the bowling center (n)
• Number of lanes from the sample of lanes inspected that meet the certification requirements (x)
• The amount of tolerable risk in making an incorrect decision (α)
The exact calculation for the lower bound of the confidence interval for attribute data is:
Where:
Otherwise you would call
• v1 = 2â–ªx
• v2 = 2â–ª(n-x+1)
• F is a statistical constant, based on the tolerable risk and the relationship between the sample size and the number of samples that meet the attribute
Note that the total number of lanes in a bowling center is not a variable used in any of the calculations.
Suppose a proposal was made to inspect 24 of 48 lanes in a bowling center. All 24 lanes in that bowling center meet the requirements for certification. Can the assumption be made that all 48 lanes in the bowling center will meet the certification requirements?
• p = 0.99 i.e. (at least) 99% of the lanes will meet the criteria for certification
• n = 24 i.e. the number of lanes to be inspected
• x = 24 i.e. the number of lanes inspected that meet the criteria for certification
• α = 0.01 i.e. the USBC has a 1% tolerable risk for making an error in decision
The hypothesis test is set up as follows:
Ho: p ≤ 0.99 i.e. the percentage of the lanes in the house meeting certification requirements is less than or equal to 99%
Ha: p > 0.99 i.e. the percentage of the lanes in the house meeting certification is greater than 99%
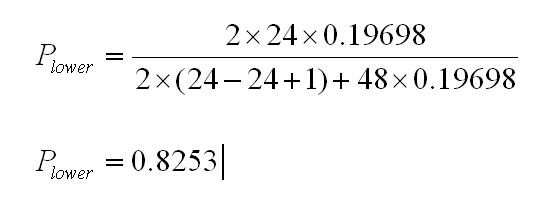
The lower confidence bound is calculated as follows:
Ho: p ≤ 0.99 i.e. the percentage of the lanes in the house meeting certification requirements is less than or equal to 99%
Ha: p > 0.99 i.e. the percentage of the lanes in the house meeting certification is greater than 99%
The lower confidence bound is calculated as follows:
Since the target (0.99) is greater than the lower confidence bound, the hypothesis test fails — that is, one cannot say for certain that at least 99% of the lanes in the bowling center will meet the certification requirements. Based on the number of samples collected (24 of 48 lanes), one can only be certain that at least 82.5% of the lanes would meet the certification requirements.
Similarly, a sample size of 36 lanes yields a lower confidence bound of 88%; a sample size of 44 lanes yields a lower confidence bound of 90%. Even a sample size of 47 lanes yields a lower confidence bound of 91%. Therefore, the entire population of a 48 lane center must be inspected to ensure with statistical confidence that the all the lanes in the bowling center meet the certification requirements.
Using a statistical methodology and approach and in the case of 1% tolerable risk for an incorrect decision and a target performance of at least 99% percent of the population of lanes meeting the certification requirements, a bowling center would need to have approximately 475 sample lanes. Therefore, we conclude that we must continue to inspect all the lanes in the bowling center to be statistically confident that all lanes in that bowling center meet the certification requirements.
Similarly, a sample size of 36 lanes yields a lower confidence bound of 88%; a sample size of 44 lanes yields a lower confidence bound of 90%. Even a sample size of 47 lanes yields a lower confidence bound of 91%. Therefore, the entire population of a 48 lane center must be inspected to ensure with statistical confidence that the all the lanes in the bowling center meet the certification requirements.
Using a statistical methodology and approach and in the case of 1% tolerable risk for an incorrect decision and a target performance of at least 99% percent of the population of lanes meeting the certification requirements, a bowling center would need to have approximately 475 sample lanes. Therefore, we conclude that we must continue to inspect all the lanes in the bowling center to be statistically confident that all lanes in that bowling center meet the certification requirements.